 Start a project
 Research prototype · sample and historical data
Walk through Hyperion,one past storm at a time.
Six screens from the Hyperion research front-end, captured with historical storm data. See how an operator moves from a territory to a storm to the evidence behind a score.

How to read this
Real screens. Historical evidence. No live forecast.
These screens were captured from the Hyperion front-end running locally with its historical event data and a demo operator. The live operator surface is not public, and nothing on this page is a flood forecast.
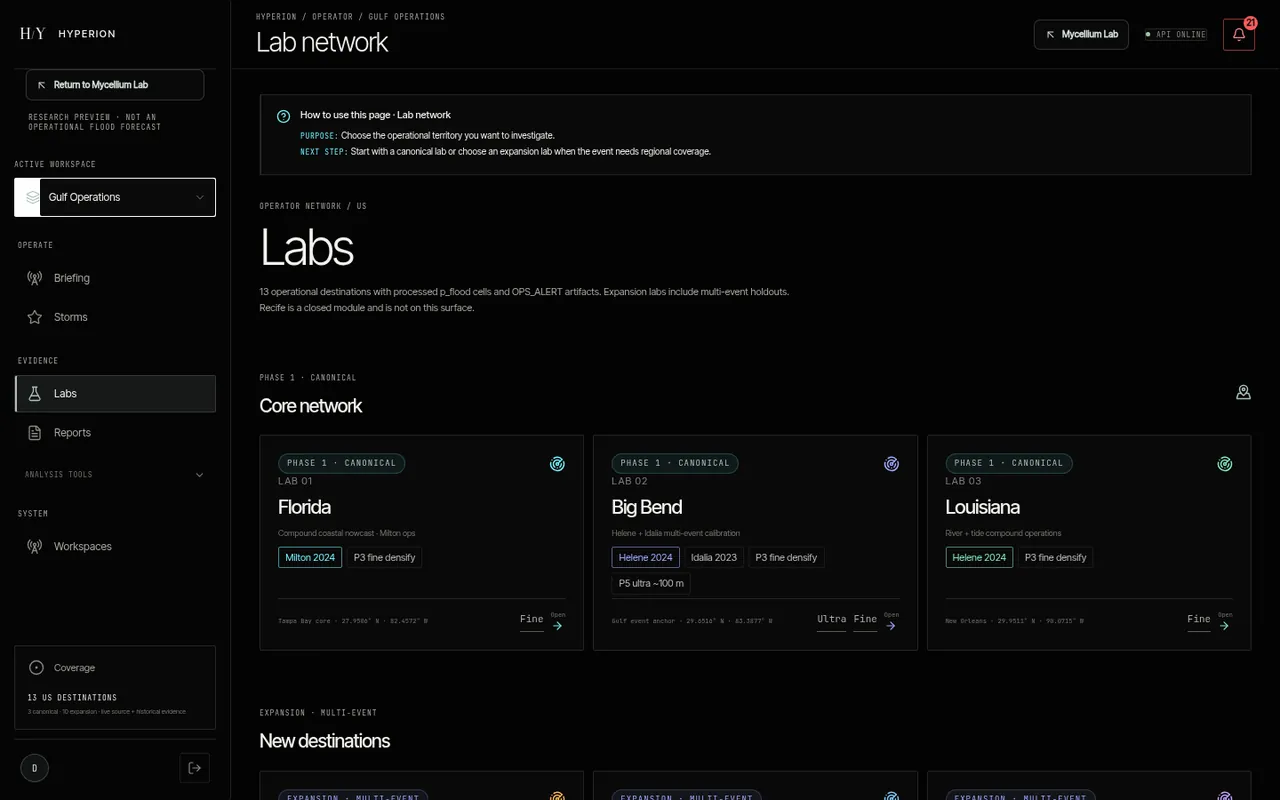
Choose a territory
Thirteen US research contexts.
The operator starts by picking a territory. Florida, the Big Bend and Louisiana are the phase-1 canonical labs; expansion labs carry multi-event holdouts. Recife is a closed module and is not on this surface.
Start from a known storm
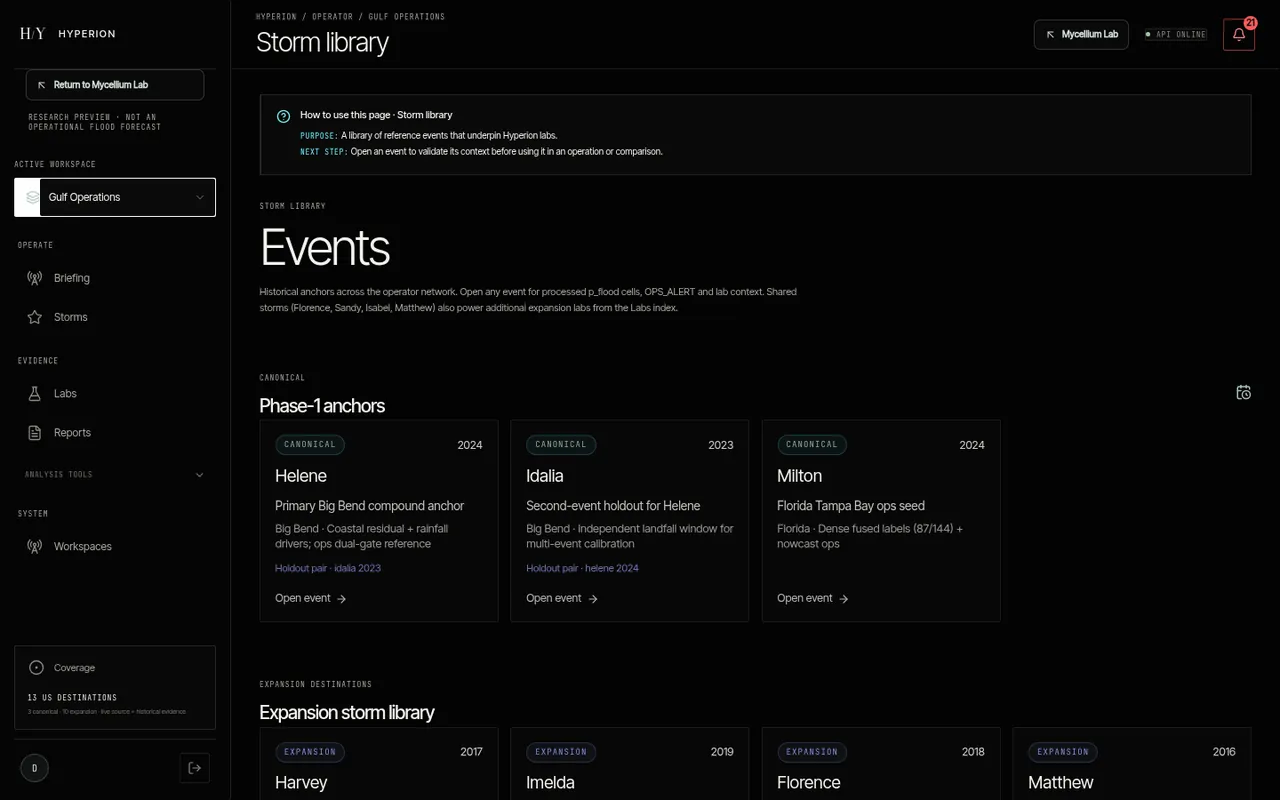
Every lab is anchored to real past events.
The storm library holds the historical reference events behind each lab, such as Helene 2024, Idalia 2023 and Milton 2024. Opening one shows its evidence before it is used in an operation or a comparison.
Read the event
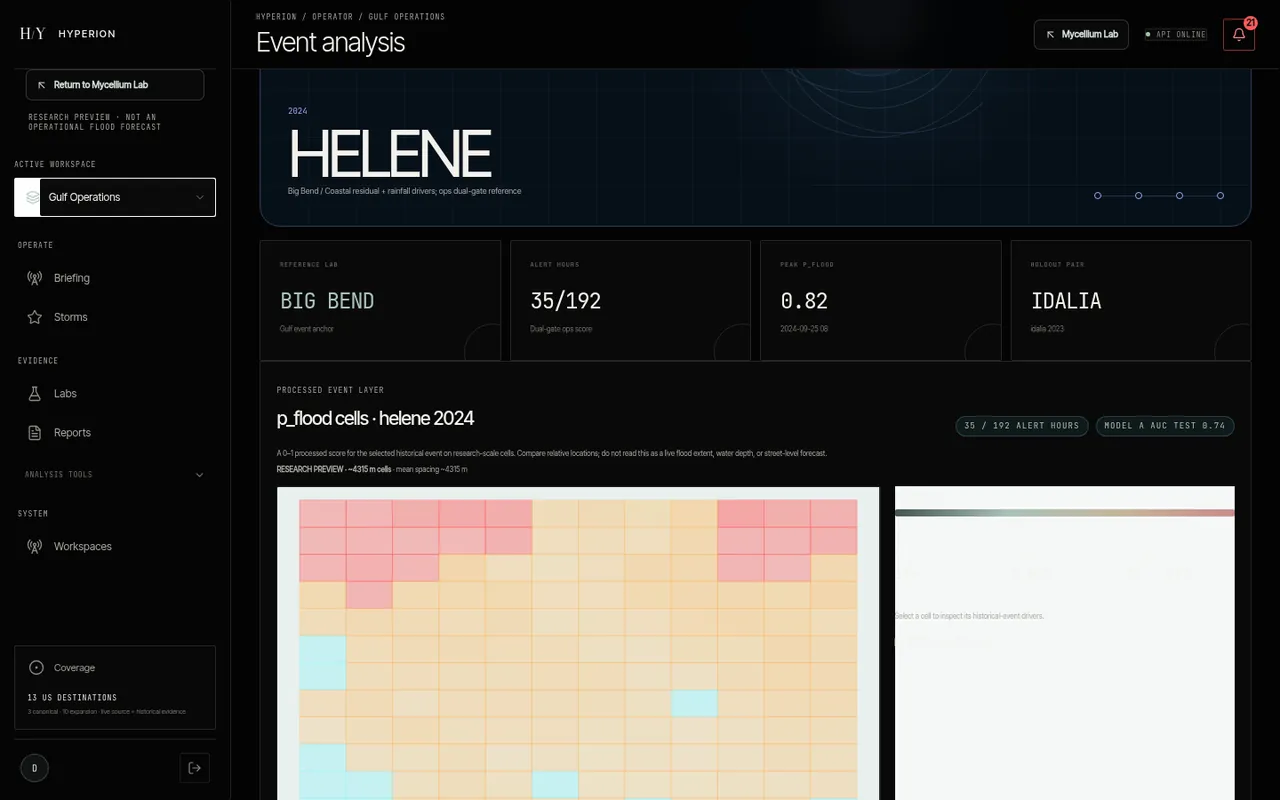
Helene 2024, read as evidence.
The event page summarizes the reference lab, alert hours against the dual-gate ops score, the peak processed score and its holdout pair. These values come from processed historical artifacts.
Inspect the cells
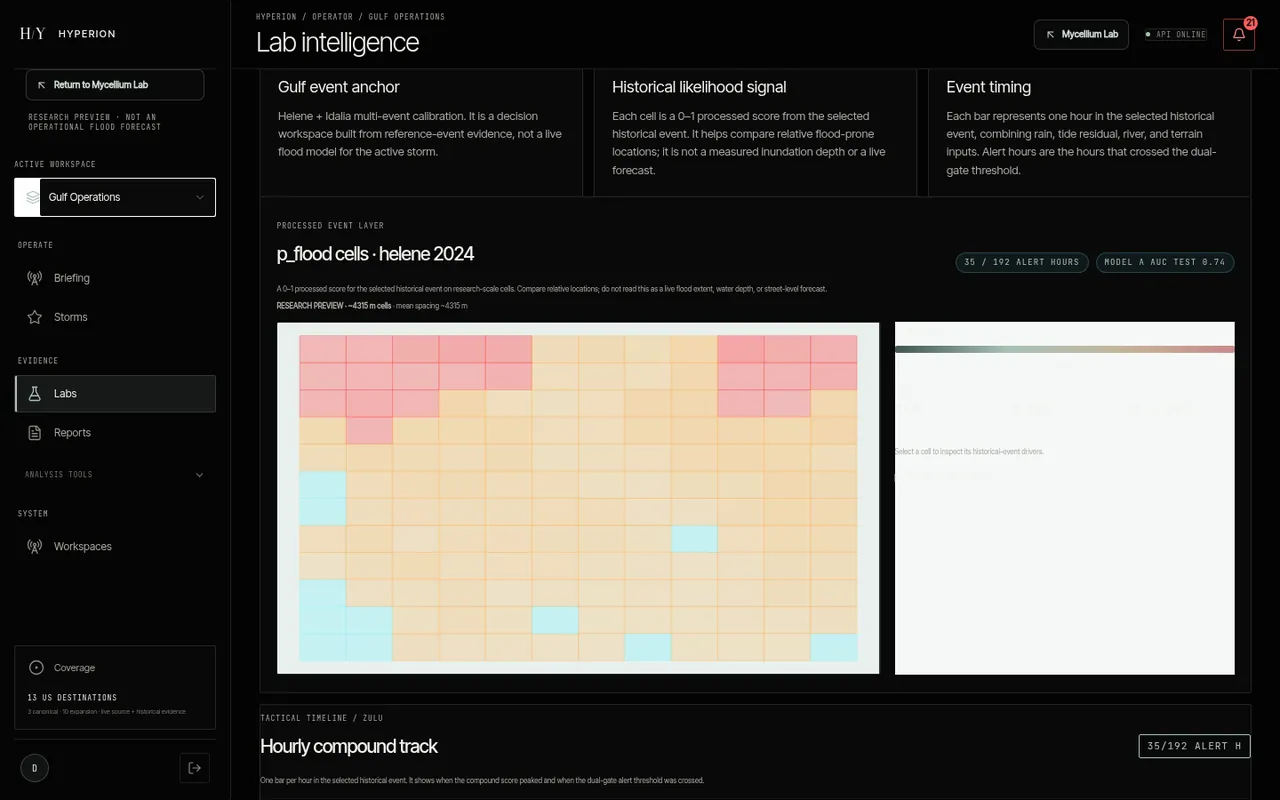
A 0 to 1 score per research cell.
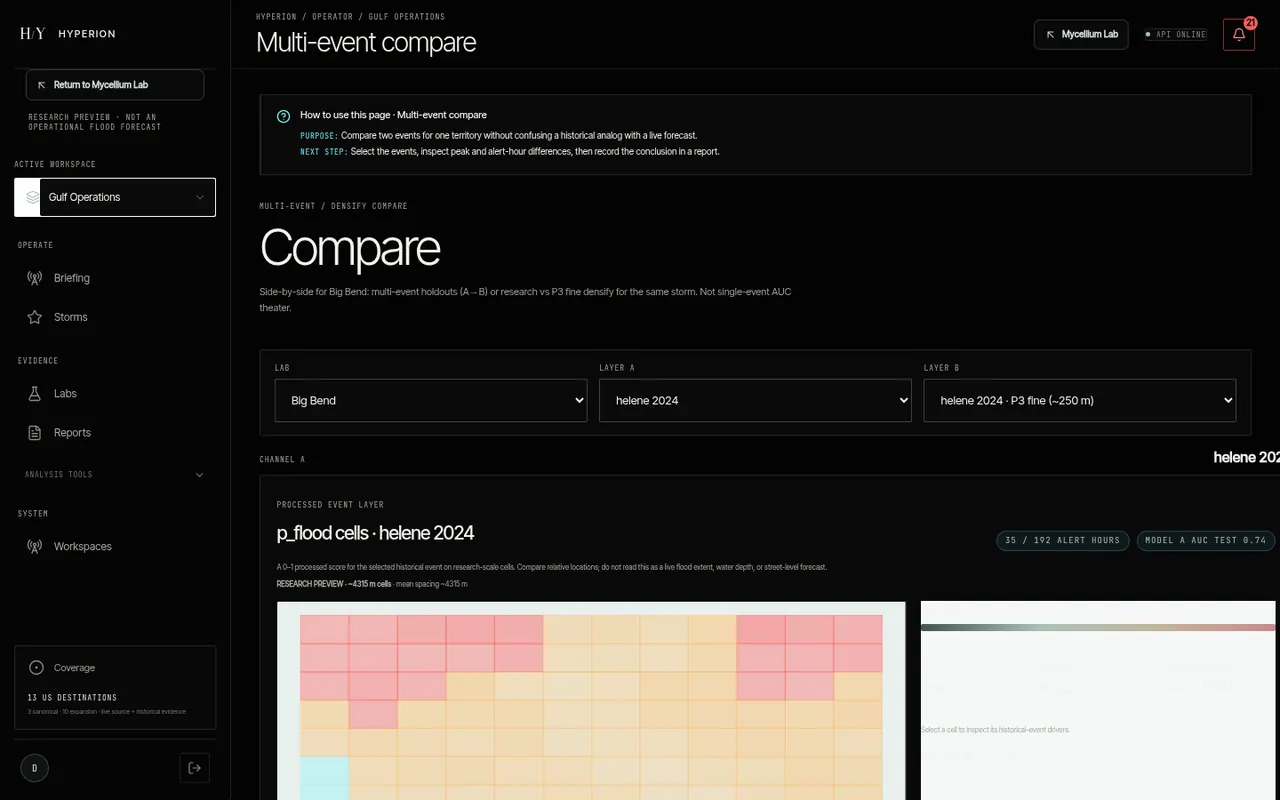
Each cell shows a processed score for the selected historical event on a kilometer-scale research grid. The product says so on screen: compare relative locations, and do not read it as a live flood extent, water depth or street-level forecast.
Compare, carefully
Two layers side by side.
Compare places two event layers for one territory next to each other, for example Helene 2024 at research scale against a denser focus grid, so a historical analog is never confused with a forecast.
Live vs historical
Two kinds of information, never mixed.
From the Hyperion public evidence pack. This walkthrough shows only the historical side.
What is live
- Live tropical context comes from the NHC CurrentStorms snapshot.
- Live alert context comes from NWS CAP and weather.gov alert snapshots.
- Every live snapshot carries its freshness, age and stale state. Stale or missing snapshots are shown as unavailable or stale, never as a fresh all-clear.
What is historical
- Lab cell layers, compound-event scores, OPS reports, conformal thresholds and backtest metrics are processed historical evidence.
- Historical evidence is not a live flood forecast, surveyed inundation truth, or a guarantee of street-level depth.
- The research grid remains a kilometer-scale prototype; domain-wide 50 to 100 m operational skill is not shipped.
- Preparing a historical analog for an active storm does not create a live flood forecast for that storm.
07 / Limits
A research prototype, shown as one.
Hyperion is a classical machine-learning research prototype for compound flood events. Operator access is by request and open sign-up is closed. Scores are research outputs with visible uncertainty, not deterministic or address-level predictions.
Credits
Sources and imagery.
Product-home photograph: NASA / ISS Expedition 64 crew, ISS064-E-26355, January 23, 2021, courtesy of the ISS Crew Earth Observations Facility and the Earth Science and Remote Sensing Unit, NASA Johnson Space Center. Regional lab imagery in the product: NASA EOSDIS GIBS / Worldview.
Data sources documented by the project: NHC, NWS, NOAA CO-OPS, USGS, NASA and OpenFEMA. Weak labels and processed artifacts keep their source-specific caveats.
Continue